Navigation
Stock Market
The stock market is undoubtedly one of the most unpredictable, yet most popular areas for financial investment. Through facilitating exchanges of securities between buyers and sellers, this marketplace creates opportunities of capital gain for participants ranging from small individuals to big entities such as banks or conglomerates.

Source from: National Stock Exchange of Indea, Ltd.
Stock Market Price Change (Label)
While there are countless financial measures in security discussions, this study focuses on one of the most direct assessments, i.e., the closing stock price. “The closing price is considered the most accurate valuation of a stock or other security until trading resumes on the next trading day” and is defined as “the last price at which the stock traded during the regular trading day” (Kenton).
As we purposefully structured this project as a classification task, this target for investigation is therefore transformed to be introduced as a binary label for model learning. For our project’s investigation purposes, we assign one class only to each day to represent trades that happen on that day. In specific, we compare the opening price to the closing price of a specific day in order to make a careful call on assigning an “increase” or “decrease” label to the combined daily stock entries.
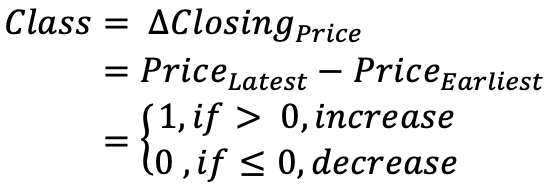
The India’s National Market Exchange market opens on 9:15 AM, and marks market closing on 3:30 PM across weekdays. We turned away from traditional considerations on pre-market hours and after-market hours for study, and adapted our target of investigation to be the price difference between the earliest opening price and latest closing price trading entries during a day. If this difference is of a positive output that signals an “increase” in stock value, while a negative output suggests the opposite. Therefore, summarizing that described above, given a particular day, we have our binary labels represented as the following:
NIFTY 100 Index Data
The stock index NIFTY 100 is specially chosen for this study. NIFTY 100 is a stock index in India’s National Stock Exchange and represents the major sectors of the country’s economy. This index is chosen after careful investigation into the condition of its available dataset. Compared to many other datasets on financial markets, NIFTY 100 stands out by its rather complete and integral structure.
Source from: Image Source
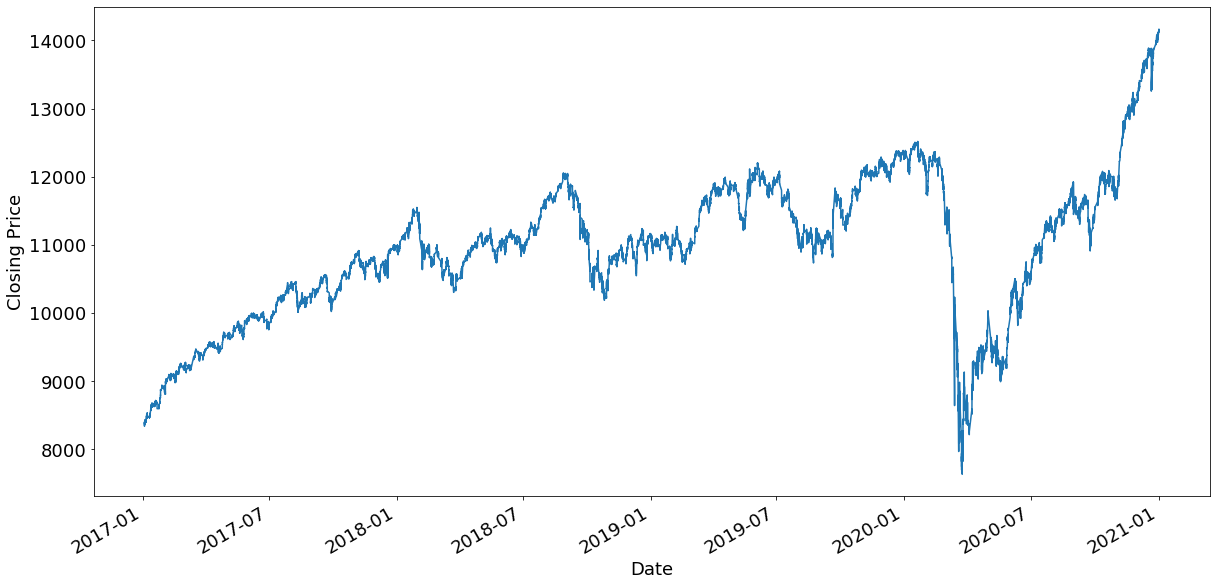
Transaction data of NIFTY 100 from January 2, 2017 to January 1, 2021 were obtained. Figure 3 is a time series representation of the closing price of the data throughout this period. Here, one interesting insight observed is how trading has been especially volatile since the coronavirus pandemic in the early 2020. Although the stock price has been increasing throughout those past years, the extreme price drop at the beginning of the pandemic illustrates the uncertainty associated with stock trading and the exceptional difficulty to predicting price movements.
Daily Closing Price of NIFTY 100 from 2017-01-02 to 2021-01-01
Minute-level Closing Price of NIFTY 100 on 2021-01-01 - Full Market Hours
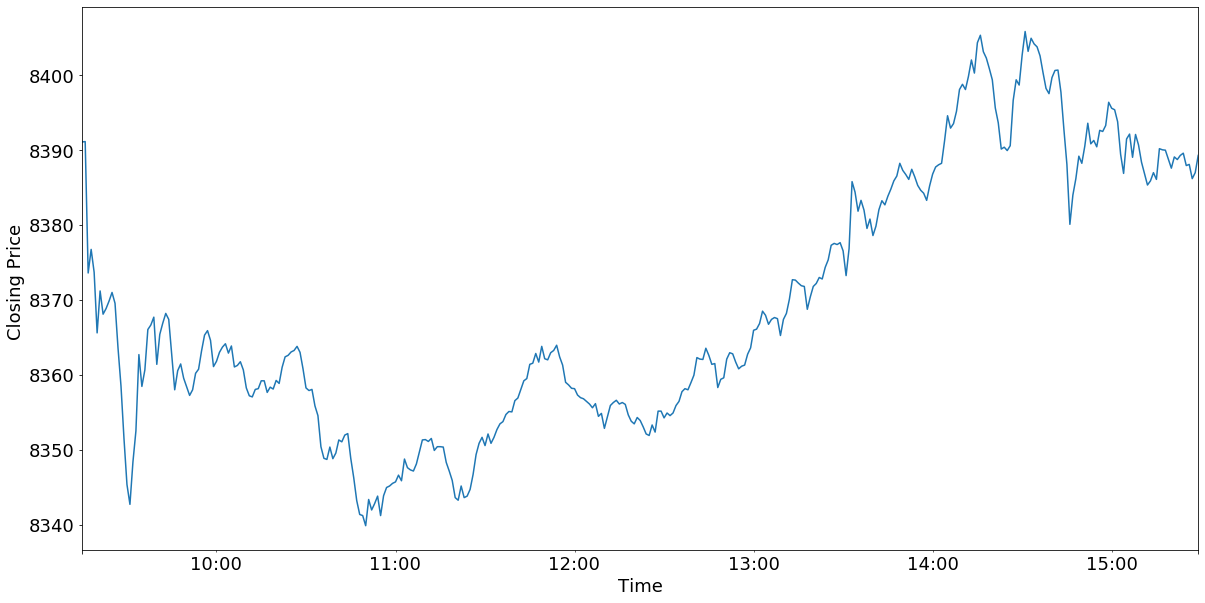
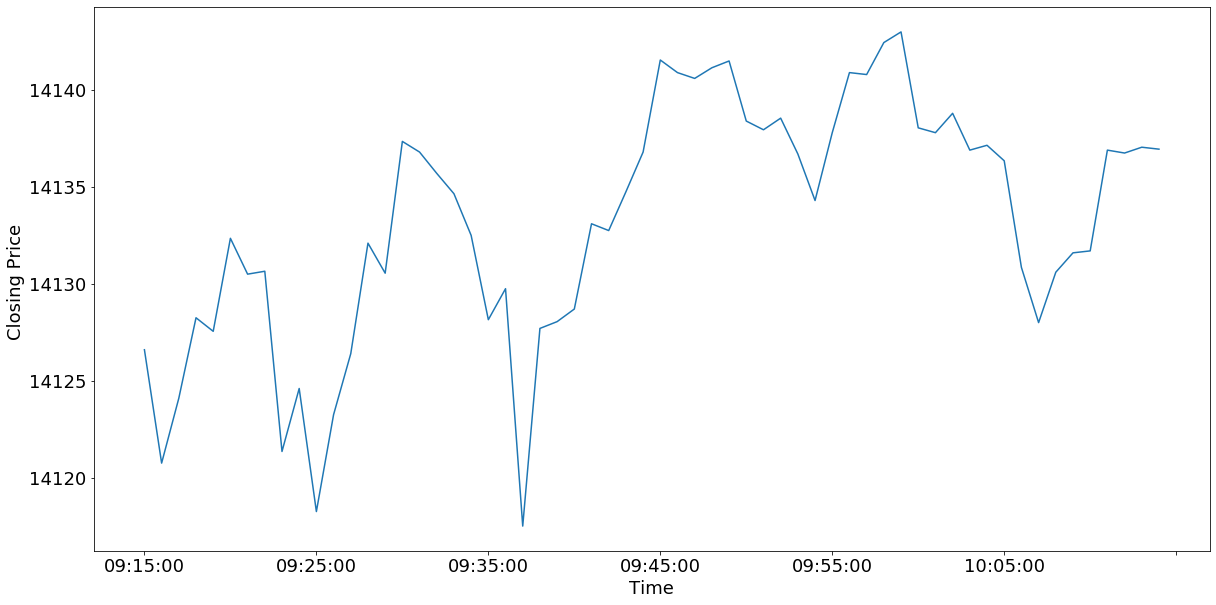
Minute-level Closing Price of NIFTY 100 on 2021-01-01 – First Market Hour.
